一、目的
Kubernetes的kubelet组件内置了cadvisor,将Node上容器的指标以Prometheus支持的格式展示,可以通过这些指标计算得到更多有用的数据.
二、Kubelet的Cadvisor指标获取
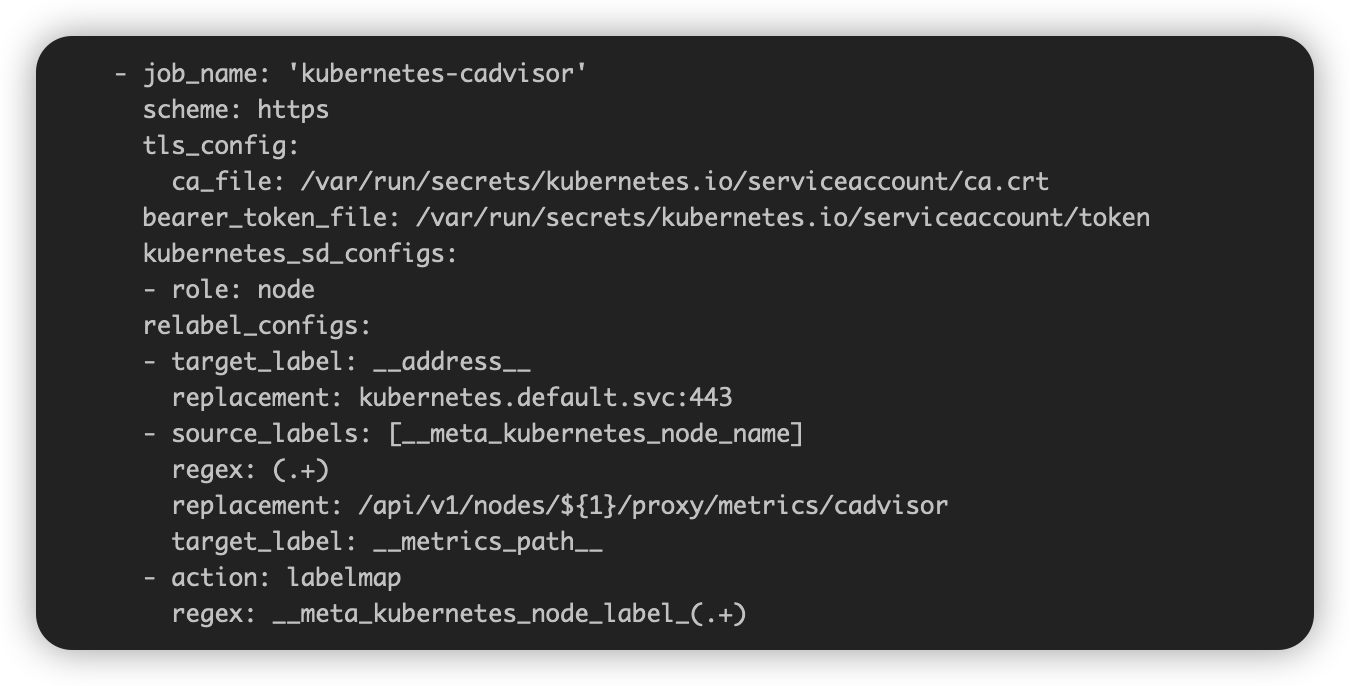
1、在Prometheus的配置文件中,配置了相关的Target之后,这些指标就可以从Prometheus中查询到。
- job_name: 'kubernetes-cadvisor'
      scheme: https
      tls_config:
        ca_file: /var/run/secrets/kubernetes.io/serviceaccount/ca.crt
      bearer_token_file: /var/run/secrets/kubernetes.io/serviceaccount/token
      kubernetes_sd_configs:
      - role: node
      relabel_configs:
      - target_label: __address__
        replacement: kubernetes.default.svc:443
      - source_labels: [__meta_kubernetes_node_name]
        regex: (.+)
        replacement: /api/v1/nodes/${1}/proxy/metrics/cadvisor
        target_label: __metrics_path__
      - action: labelmap
        regex: __meta_kubernetes_node_label_(.+)
2、直接访问Kubelet的apiserver接口,可以读取以Prometheus支持的格式呈现的指标:
$ curl https://xx.xx.xx.xx:6443/api/v1/nodes/k8s-master01/proxy/metrics/cadvisor

# HELP cadvisor_version_info A metric with a constant '1' value labeled by kernel version, OS version, docker version, cadvisor version & cadvisor revision.
# TYPE cadvisor_version_info gauge
cadvisor_version_info{cadvisorRevision="",cadvisorVersion="",dockerVersion="17.03.0-ce",kernelVersion="4.9.148",osVersion="CentOS Linux 7 (Core)"} 1
# HELP container_cpu_load_average_10s Value of container cpu load average over the last 10 seconds.
# TYPE container_cpu_load_average_10s gauge
container_cpu_load_average_10s{container_name="",id="/",image="",name="",namespace="",pod_name=""} 0
container_cpu_load_average_10s{container_name="",id="/kubepods",image="",name="",namespace="",pod_name=""} 0
container_cpu_load_average_10s{container_name="",id="/kubepods/besteffort",image="",name="",namespace="",pod_name=""} 0
container_cpu_load_average_10s{container_name="",id="/kubepods/besteffort/pod79bfae8f-0f25-11e9-bbb3-28b4484d8d14",image="",name="",namespace="",pod_name=""} 0
3、Pod CPU使用率的计算
从man top手册中找到了CPU使用率的定义:
1. %CPU -- CPU Usage The task's share of the elapsed CPU time since the last screen update, expressed as a percentage of total CPU time.

In a true SMP environment, if a process is multi-threaded and top is not operating in Threads mode, amounts greater than 100% may be reported. You toggle Threads mode with the `H' inter-active command.

Also for multi-processor environments, if Irix mode is Off, top will operate in Solaris mode where a task's cpu usage will be divided by the total number of CPUs. You toggle Irix/Solaris modes with the `I' interactive command.
即在过去的一段时间里进程占用的CPU时间与CPU总时间的比率,如果有多个CPU或者多核,需要将每个CPU的时间相加。 kubelet中的cadvisor采集的指标与含义,见:Monitoring cAdvisor with Prometheus。
其中有几项是:
| Metric name | Type | Description | Unit |
|---|---|---|---|
| container_cpu_usage_seconds_total | Counter | Cumulative cpu time consumed | seconds |
| container_spec_cpu_quota | Gauge | CPU quota of the container | |
| container_memory_rss | Gauge | Size of RSS | bytes |
| container_spec_memory_limit_bytes | Gauge | Memory limit for the container | bytes |
| container_fs_usage_bytes | Gauge | Number of bytes that are consumed by the container on this filesystem | bytes |
container_cpu_usage_seconds_total是container累计使用的CPU时间,用它除以CPU的总时间,就得到了容器的CPU使用率。
Pod 在1s内累计使用的CPU时间为:
sum(rate(container_cpu_usage_seconds_total{image!=""}[1m])) by (pod_name, namespace)
container_spec_cpu_quota是容器的CPU配额,它的值是:为容器指定的CPU个数*100000。
故,Pod在1s内CPU的总时间为:Pod的CPU核数 * 1s:
(sum(container_spec_cpu_quota{image!=""}/100000) by (pod_name, namespace))
将上面两个公式的结果相除,就得到了容器的CPU使用率:
sum(rate(container_cpu_usage_seconds_total{image!=""}[1m])) by (pod_name, namespace) / (sum(container_spec_cpu_quota{image!=""}/100000) by (pod_name, namespace)) * 100
4、Pod内存使用率的计算
Pod 内存使用率的计算就简单多了,直接用内存实际使用量除以内存限制使用量即可:
sum(container_memory_rss{image!=""}) by(pod_name, namespace) / sum(container_spec_memory_limit_bytes{image!=""}) by(pod_name, namespace) * 100 != +inf
5、Pod 文件系统使用量
sum(container_fs_usage_bytes{image!=""}) by(pod_name, namespace) / 1024 / 1024 / 1024
6、Prometheus pod 流量监控
1 问题描述
监控某个服务对应 pod 的流量,将 pod 的流量呈现在 dashboard 上,并且作为监控告警的依据。
2 解决办法
kube-state-metrics 是 K8S 官方项目,会采集pod、deployment等资源的元信息。使用 container_network_receive_bytes_total container_network_transmit_bytes_total 来检索进出 pod 的流量。由于 pod 可能会重启,这样检索出来的数据可能会分成多个段,可以简单的使用 sum 这样的函数来聚合。 2.1 查询语句
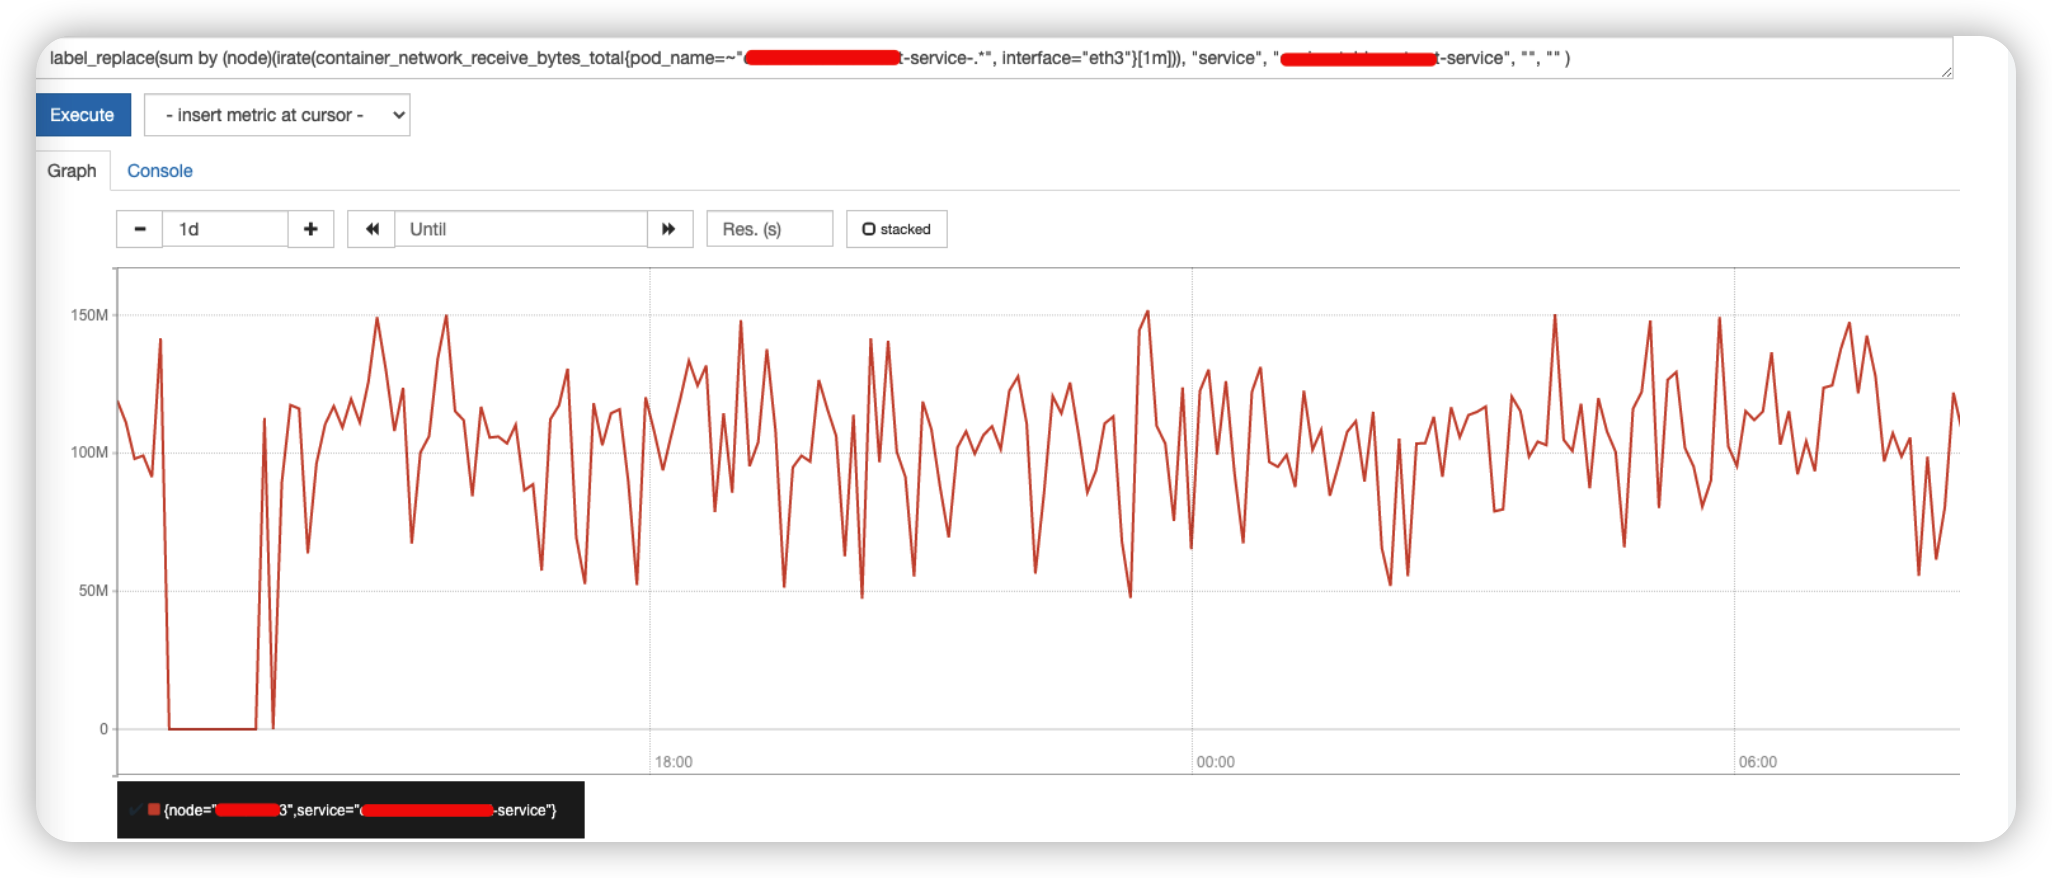
完整的检索语句:
label_replace(sum by (node)(irate(container_network_receive_bytes_total{pod_name=~"x-service-.*", interface="eth3"}[1m])), "service", "x-service", "", "" )
- irate(container_network_receive_bytes_total{pod_name=~”x-service-.*”, interface=”eth3”}[1m]) : 计算 x-service 这个服务 eth3 网口的进流量。
- sum by (node)(irate(container_network_receive_bytes_total{pod_name=~”x-service-.*”, interface=”eth3”}[1m])) : 对应 pod 重启的情况,将重启前后多个 pod 的数据做聚合。
- label_replace :用来给查询出来的数据添加 service:x-service 的标签。